What is Image Thresholding?
Thresholding is a image processing method used to convert a grey scale image (value of pixels ranging from 0-255) into binary image (value of pixels can have only 2 values: 0 or 1). Thresholding techniques are mainly used in segmentation The simplest thresholding methods replace each pixel in an image with a black pixel if the pixel intensity is less than some fixed constant T, else it is replace with a white pixel.
If I (i,j) is the intensity at point (i,j) in an image, then:
I(i,j) = 0 if I(i,j)<T
else I(i,j) = 1
where T is some threshold value.
There are two basic types of thresholding methods:
Static image thresholding
Dynamic image thresholding
More simple and straight forward approach is taken in static thresholding. A pre-determined threshold value is used for segmentation in static image thresholding. It is effective when the background conditions in which image is captured are well known and they do not change. But, if they change, will the threshold value be effective in image segmentation?
Well as you must have correctly recognised, it wont. For instance, the static or pre-determined threshold value wont be effective for handling illumination changes.
Well as you must have correctly recognised, it wont. For instance, the static or pre-determined threshold value wont be effective for handling illumination changes.
What do you do in such conditions? We have dynamic thresholding methods to rescue. They are not effected by such changes. Now, there are various dynamic thresholding techniques, of which the one I found very interesting is OTSU thresholding. I will try explaining the algorithm in detail in this post.
OTSU Thresholding:
This method is named after its inventor Nobuyuki Otsu and is one of the many binarization algorithm. The post here will describe how the algorithm works and C++ implementation of algorithm. OpenCV has in-built implementation of OTSU thresholding technique which can be used.
The algorithm assumes that the image contains two classes of pixels following bi-modal histogram (foreground pixels and background pixels), it then calculates the optimum threshold separating the two classes so that their combined spread (intra-class variance) is minimal, or equivalently (because the sum of pairwise squared distances is constant), so that their inter-class variance is maximal. Consequently, Otsu's method is roughly a one-dimensional, discrete analog of Fisher's Discriminant Analysis. Otsu's thresholding method involves iterating through all the possible threshold values and calculating a measure of spread for the pixel levels each side of the threshold, i.e. the pixels that either fall in foreground or background. The aim is to find the threshold value where the sum of foreground and background spreads is at its minimum.
Algorithm steps:
- Compute histogram and probabilities of each intensity level.
- Set up initial class probability and initial class means.
- Step through all possible thresholds maximum intensity.
- Update qi and μi.
- Compute between class variance.
- Desired threshold corresponds to the maximum value of between class variance.
Example:
The example below is taken from this page. The algorithm will be demonstrated using the simple 6x6 image shown below. The histogram for the image is shown next to it. To simplify the explanation, only 6 greyscale levels are used.
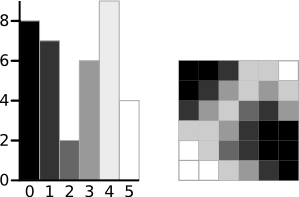
A 6-level greyscale image and its histogram
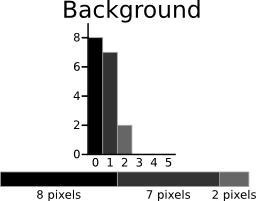
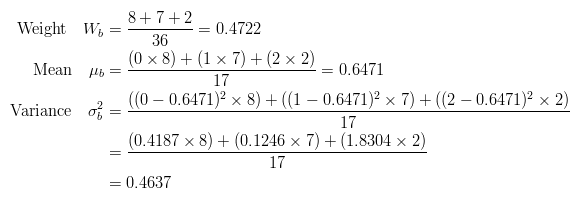
The calculations for finding the foreground and background variances (the measure of spread) for a single threshold are now shown. In this case the threshold value is 3.
 |  |
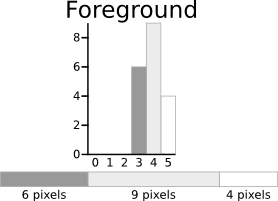 | 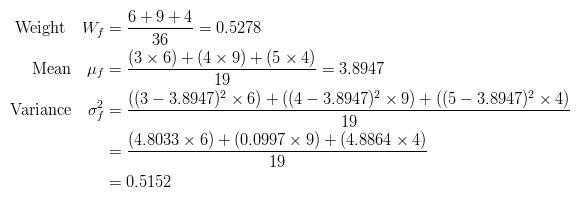 |
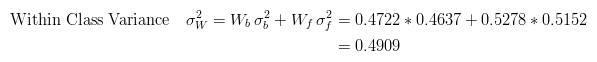
The next step is to calculate the 'Within-Class Variance'. This is simply the sum of the two variances multiplied by their associated weights.
This final value is the 'sum of weighted variances' for the threshold value 3. This same calculation needs to be performed for all the possible threshold values 0 to 5. The table below shows the results for these calculations. The highlighted column shows the values for the threshold calculated above.

It can be seen that for the threshold equal to 3, as well as being used for the example, also has the lowest sum of weighted variances. Therefore, this is the final selected threshold. All pixels with a level less than 3 are background, all those with a level equal to or greater than 3 are foreground. As the images in the table show, this threshold works well.

Result of Otsu's Method
This approach for calculating Otsu's threshold is useful for explaining the theory, but it is computationally intensive, especially if you have a full 8-bit greyscale. The next section shows a faster method of performing the calculations which is much more appropriate for implementations.
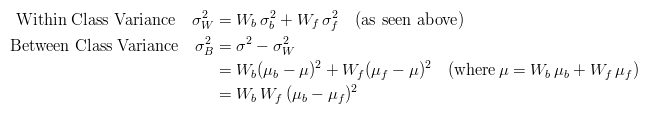
A Faster Approach
By a bit of manipulation, you can calculate what is called the between class variance, which is far quicker to calculate. Luckily, the threshold with the maximum between class variance also has the minimum within class variance. So it can also be used for finding the best threshold and therefore due to being simpler is a much better approach to use.

Implementation:
The OpenCV / C++ implementation of OTSU thresholding can be downloaded from here.
OpenCV also a built-in function from thresholding using OTSU method, which can be used as:
cv::threshold(im_gray, img_bw, 0, 255, CV_THRESH_BINARY | CV_THRESH_OTSU);
where 'im_gray' is the gray image for which thresholding value has to be calculated. 'img_bw' is the black and white image obtained after using OTSU thresholding method on gray image.
Advantages
- Speed: Because Otsu threshold operates on histograms (which are integer or float arrays of length 256), it’s quite fast.
- Ease of coding: Approximately 80 lines of very easy stuff.
Disadvantages
- Assumption of uniform illumination.
- Histogram should be bimodal (hence the image).
- It doesn’t use any object structure or spatial coherence.
- The non-local version assumes uniform statistics.
really good
ReplyDeleteNice Information Keep Updating Data Science online Course
ReplyDeleteThanks :) It was useful information.
ReplyDeleteThanks for the blog article.Much thanks again. Fantastic.
ReplyDeletemachine learning training in hyderabad
machine learning course in hyderabad